3.3 KiB
1. Service Provides Metrics Interface
Create a metrics.py file in the webapi/providers directory to provide the Metrics interface.
Content as follows:
# Prometheus metric prefix is : freeleaps_metrics
def register(app):
  instrumentator = (
      Instrumentator().instrument(
        app,
        metric_namespace="freeleaps",
        metric_subsystem="metrics",)
  )

  @app.on_event("startup")
  async def startup():
    instrumentator.expose(app, endpoint="/api/_/metrics", should_gzip=True)
    logging.info("Metrics endpoint exposed at /api/_/metrics")
Reference the integration approach at https://gitea.freeleaps.mathmast.com/freeleaps/freeleaps-service-hub/src/branch/master/apps/metrics
2. Configure Metrics Collection
2.1. Find the helm pkg directory
For freeleaps internal services, you need to find the helm-package configuration for the service deployment in the freeleaps-ops repository
For example, the metrics service configuration is at
https://gitea.freeleaps.mathmast.com/freeleaps/freeleaps-ops/src/branch/master/freeleaps/helm-pkg/metrics
For freeleaps tenant services (deployed via one-click), you need to find .freeleaps/devops/helm-pkg in the corresponding service repository
For example, the magicleaps service configuration is at
https://gitea.freeleaps.mathmast.com/products/magicleaps/src/branch/main/.freeleaps/devops/helm-pkg
2.2. Add servicemonitor configuration
Add a servicemonitor.yaml file in the templates folder with the following content, referencing https://gitea.freeleaps.mathmast.com/freeleaps/freeleaps-ops/src/branch/master/freeleaps/helm-pkg/notification/templates/notification/servicemonitor.yaml
Update necessary content based on the configuration in value.yaml, for example, change line 6 from notification to metrics
2.3. Modify value.{alpha|prod}.yaml
Add serviceMonitor configuration, referencing https://gitea.freeleaps.mathmast.com/freeleaps/freeleaps-ops/src/branch/master/freeleaps/helm-pkg/notification/values.prod.yaml
  - name: notification-service
    type: ClusterIP
    port: 8003
    targetPort: 8003
    serviceMonitor:
      enabled: true # Set to false for alpha environment
      labels:
        release: kube-prometheus-stack
      namespace: freeleaps-monitoring-system
      internal: 30s
      scrapeTimeout: ''
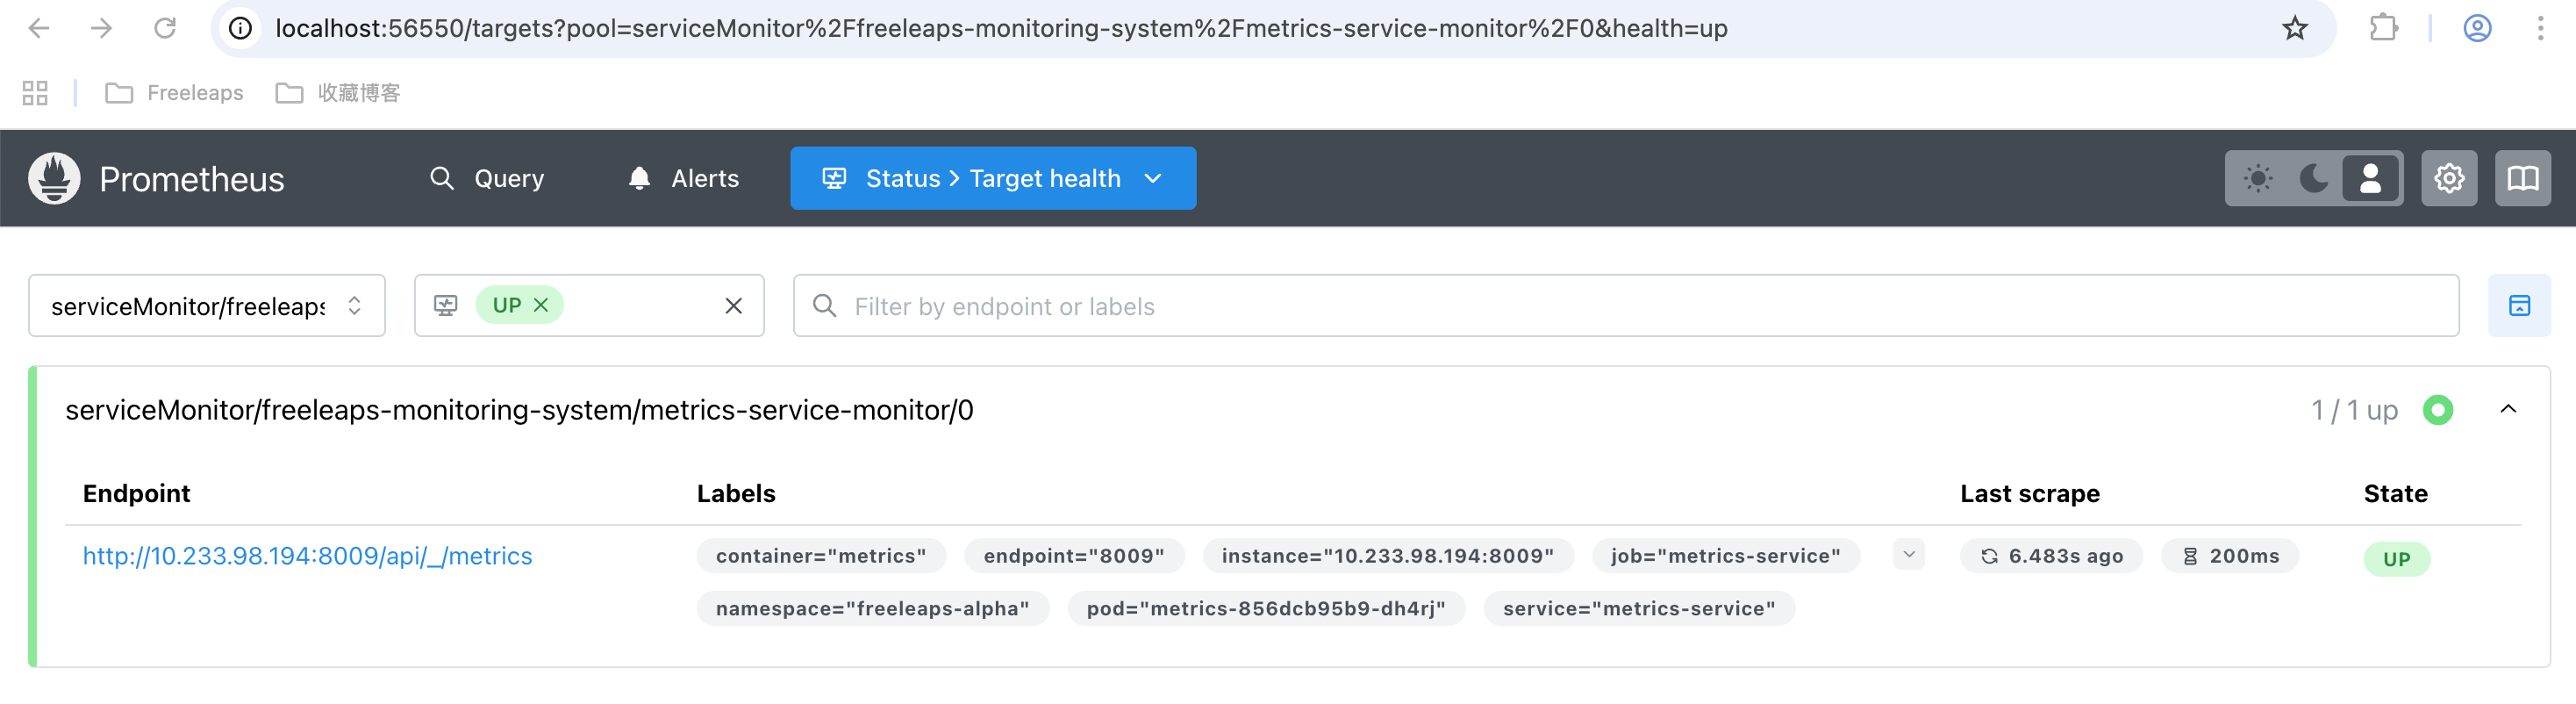
2.4. Verify Metrics Collection Results
Forward the service [kube-prometheus-stack-prometheus] to local port through LENS, access http://localhost:9090/targets to check if the corresponding Endpoint can be found
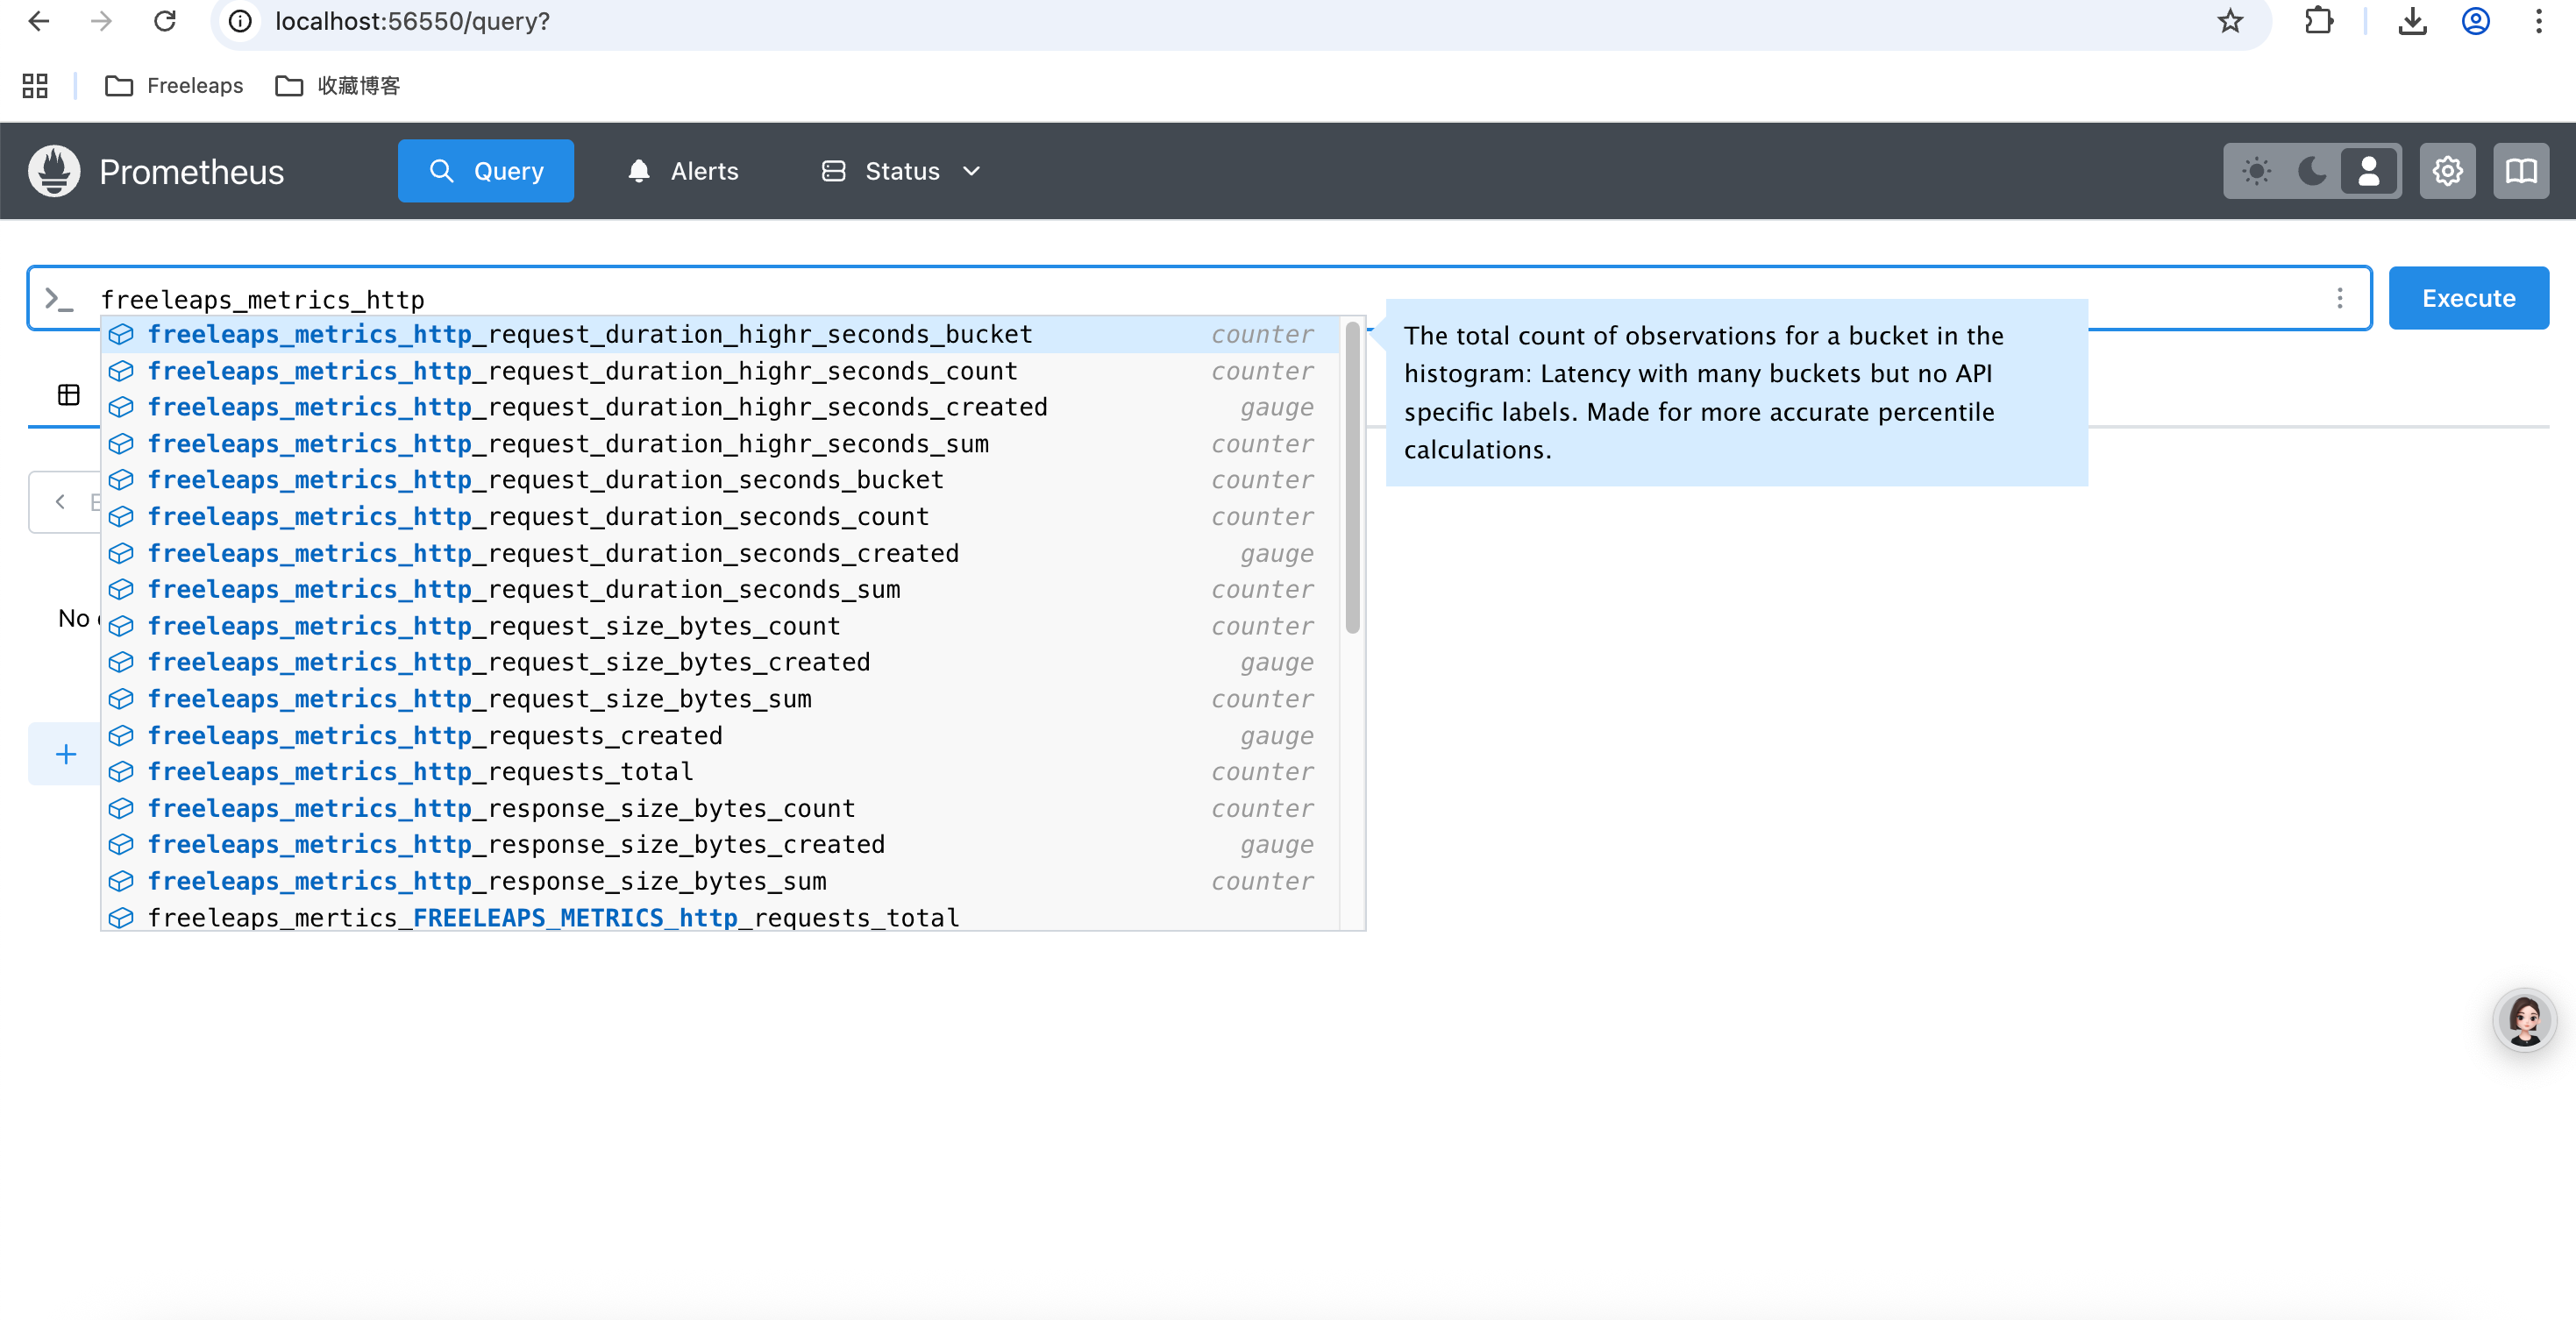
 Access
 http://localhost:9090/query to check if the corresponding metrics can be found
3. Configure Grafana Dashboard
3. Configure Grafana Dashboard
3.1. Add dashboard.yaml under helm-pkg
Content reference https://gitea.freeleaps.mathmast.com/freeleaps/freeleaps-ops/src/branch/master/freeleaps/helm-pkg/notification/templates/notification/dashboard.yaml
3.2. Modify value.{alpha|prod}.yaml
dashboard:
  enabled: true # Set to false for alpha environment
  name: freeleaps-prod-metrics-dashboard
  title: Freeleaps Metrics Dashboard (PROD/ALPHA)
  metricsPrefix: freeleaps_metrics
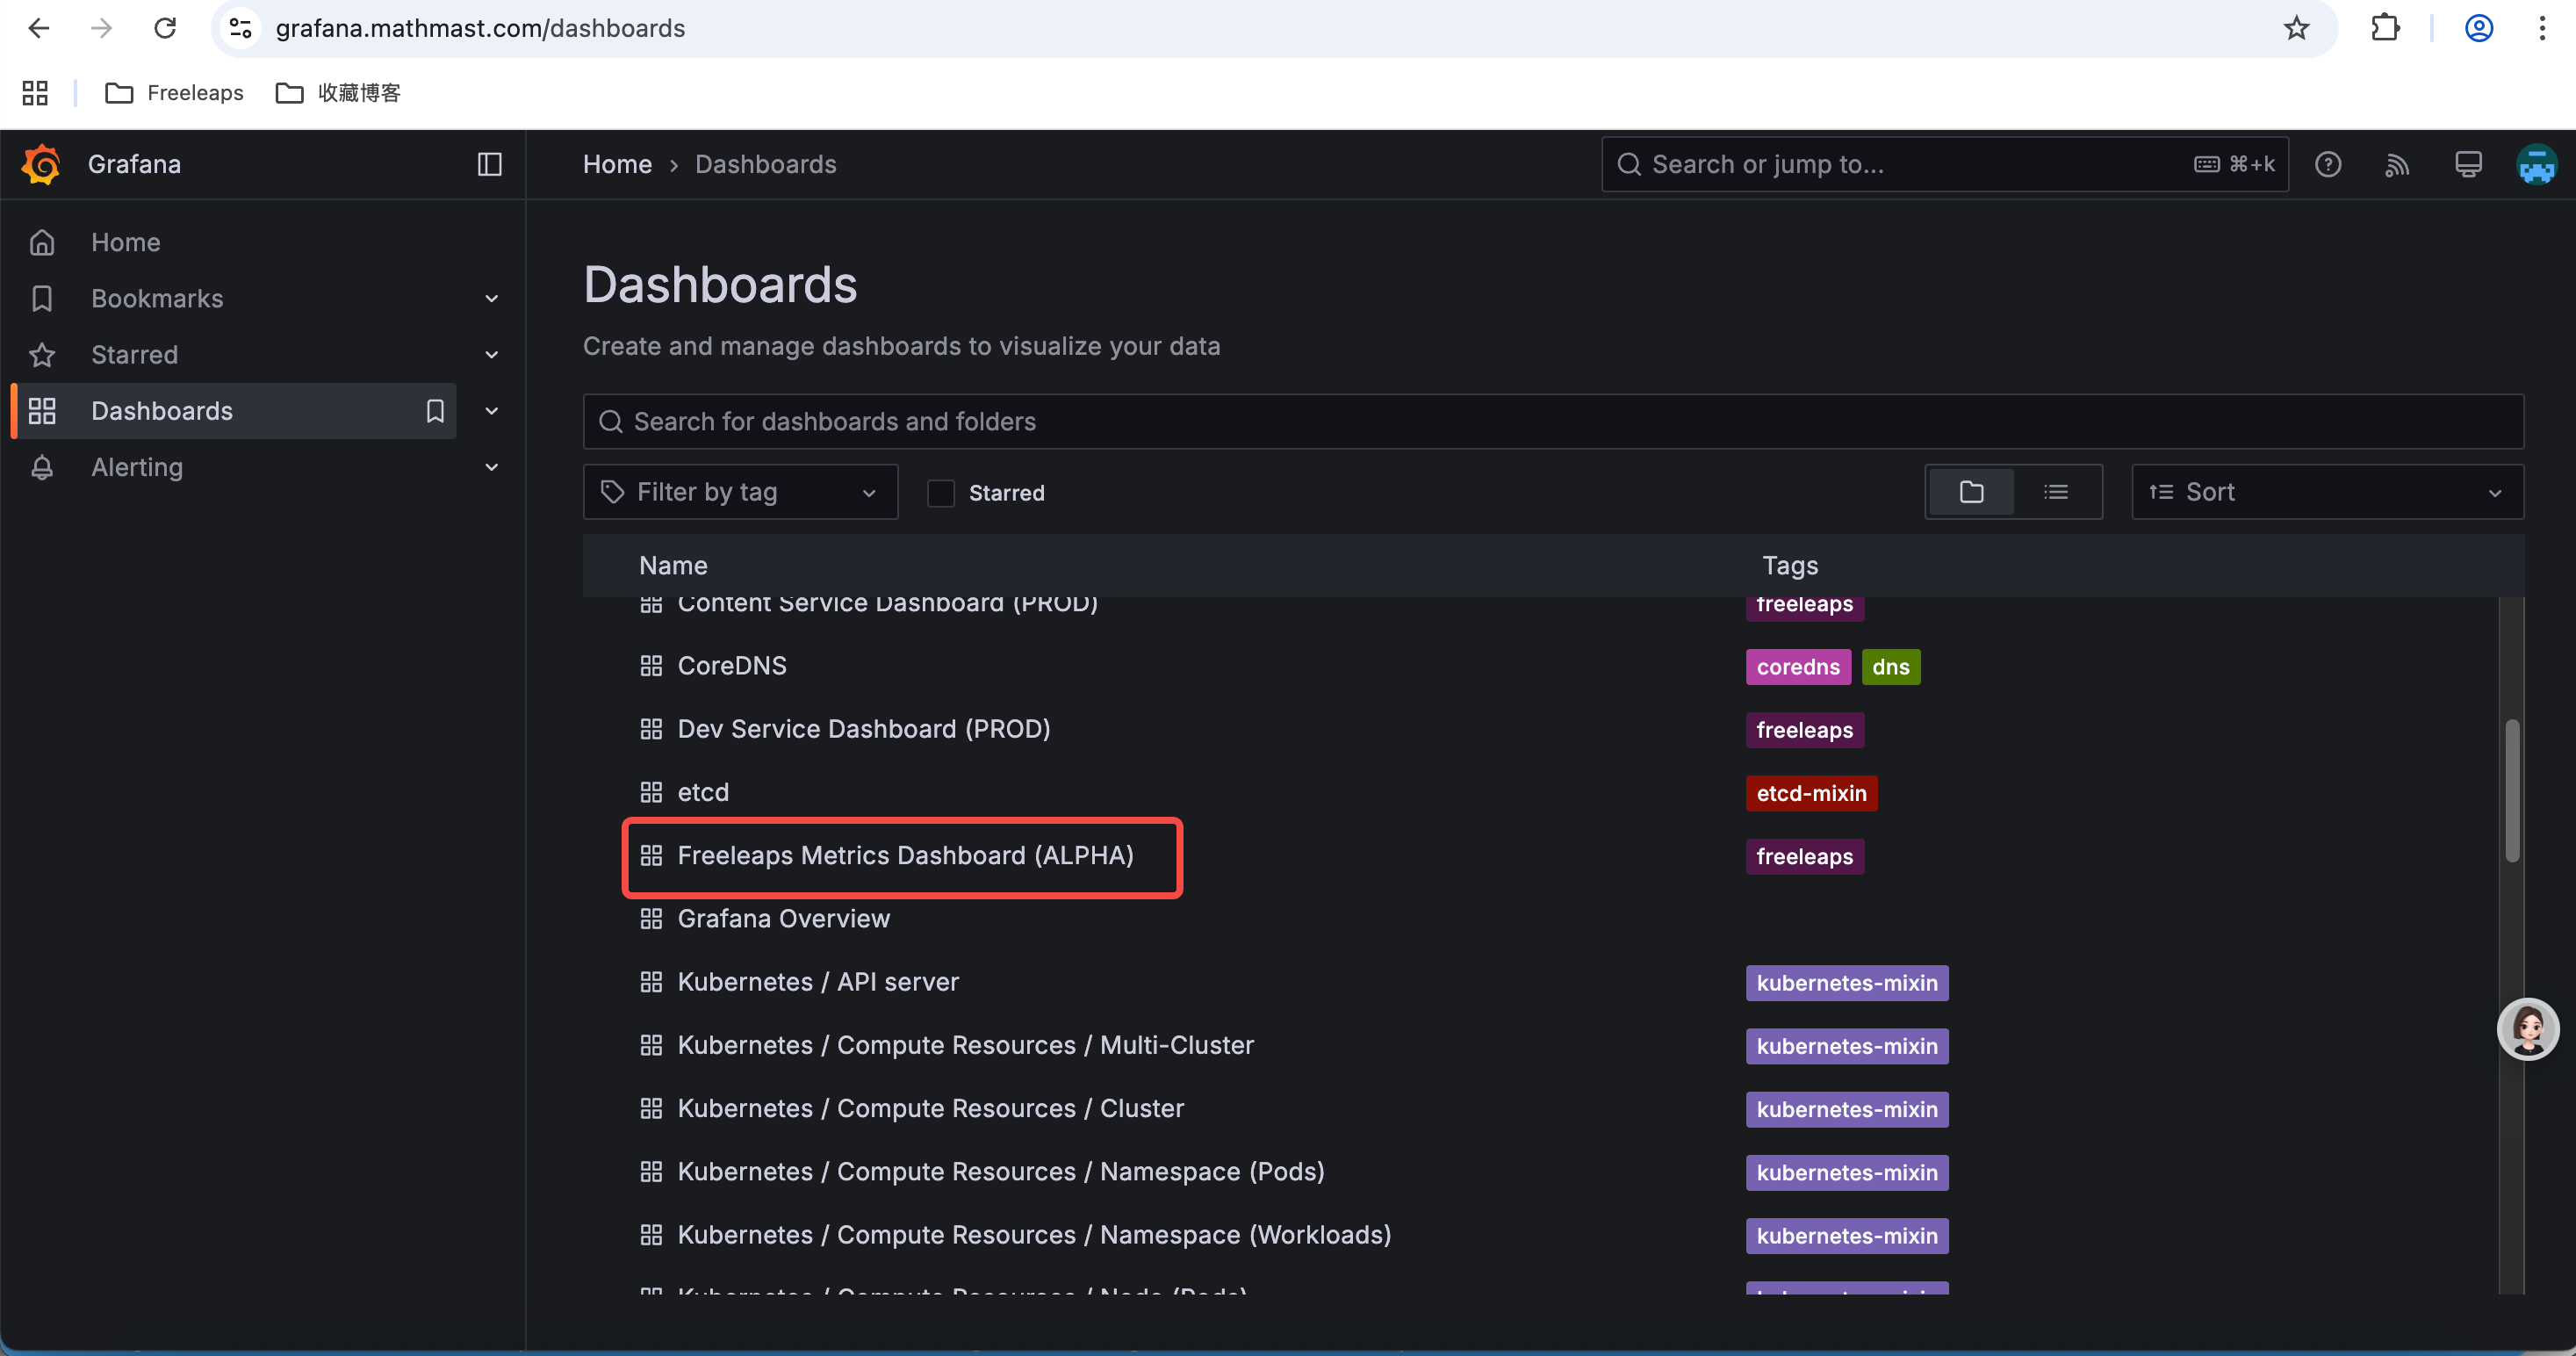
3.3. Verify Dashboard Addition
Login to https://grafana.mathmast.com to check if the dashboard was added successfully